11 Mar 2014
Four in 10 wealthy Americans “don’t feel good about the money they have to spend”
WASHINGTON, D.C. (March 7 2014) Gallup Polls — While Americans’ average daily self-reported spending increased in 2013, many Americans nonetheless expressed anxiety about how much money they had to spend. Less than half (45%) said they felt “pretty good” about it. Lower-income Americans were least likely to feel good about their amount of disposable income, but even wealthier Americans — who were more likely to feel good — were not immune to money worries.
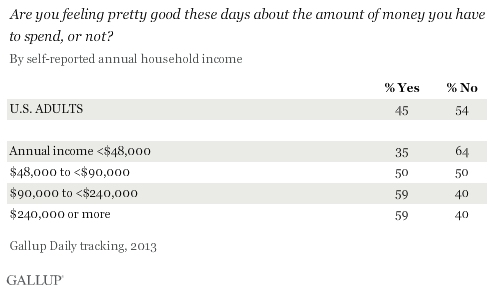
These findings are based on Gallup Daily tracking throughout 2013 with more than 178,000 U.S. adults, aged 18 and older. The spending question is one of eight that Gallup asks daily to measure Americans’ attitudes toward finances and spending.
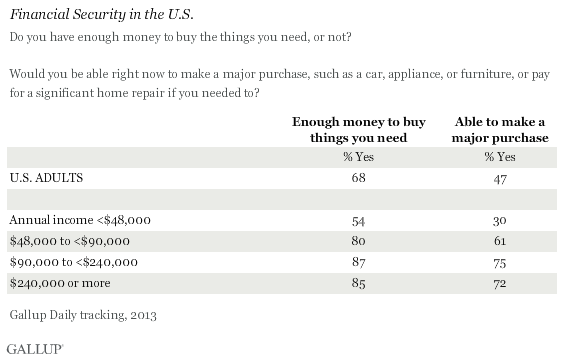
More Than One in Four Wealthy Americans Unable to Make Major Purchase
In 2013, three in 10 Americans who reported annual household incomes less than $48,000 said they would be able to make a major purchase, such as a car, appliance, or furniture, if needed, compared with at least 61% of those in higher-income groups. But among those in the $240,000+ category, barely seven in 10 said they would be able to handle such a purchase, underscoring that some of even the highest-income Americans may be leading financially precarious lives.
On the other hand, there is a wide divide between Americans in the lowest income bracket and the others on whether they have enough money to buy the things they need: a majority (54%) of Americans in households with annual incomes less than $48,000 agree with this, compared with at least 80% of those with higher incomes.
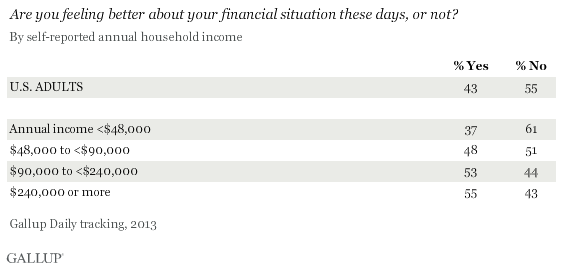
Majority Not Feeling Better About Financial Situation
At 1.9% for 2013, U.S. economic growth remained well below the 3% level that economists say will provide the “escape velocity” that will power the recovery. In this low-growth environment, the majority of Americans (55%) interviewed in 2013 said they were not feeling better about their financial situation. The poorest Americans were particularly pessimistic, with 37% saying they felt better about their financial situation. However, even for those earning between $48,000 and $89,999, less than half were upbeat about their finances. Remarkably, only small majorities of Americans in the two highest income groups say they are feeling better about their financial situation, showing that many wealthier Americans still experience some financial angst.
Bottom Line
No amount of income appears to spare Americans from common financial worries. Four in 10 of the highest-income Americans say they are not feeling better about their financial situations, and more than a quarter of them say they would not be able to handle a major purchase or home repair.
Income is important in overall financial well-being, of course, and the poorest Americans are the most sensitive to financial issues such as the ability to buy necessities and feeling good about spending capabilities. All in all, the economic recovery struggled on in 2013, but many Americans, regardless of income, weren’t feeling better.
Survey MethodsResults for this Gallup poll are based on telephone interviews conducted Jan. 2-Dec. 29, 2013, on the Gallup Daily tracking survey, with a random sample of 178,527 adults, aged 18 and older, living in all 50 U.S. states and the District of Columbia.
For results based on the total sample of national adults, the margin of sampling error is ±1 percentage point at the 95% confidence level.
Interviews are conducted with respondents on landline telephones and cellular phones, with interviews conducted in Spanish for respondents who are primarily Spanish-speaking. Each sample of national adults includes a minimum quota of 50% cellphone respondents and 50% landline respondents, with additional minimum quotas by time zone within region. Landline and cellular telephone numbers are selected using random-digit-dial methods. Landline respondents are chosen at random within each household on the basis of which member had the most recent birthday.
Samples are weighted to correct for unequal selection probability, nonresponse, and double coverage of landline and cell users in the two sampling frames. They are also weighted to match the national demographics of gender, age, race, Hispanic ethnicity, education, region, population density, and phone status (cellphone only/landline only/both, and cellphone mostly). Demographic weighting targets are based on the most recent Current Population Survey figures for the aged 18 and older U.S. population. Phone status targets are based on the most recent National Health Interview Survey. Population density targets are based on the most recent U.S. census. All reported margins of sampling error include the computed design effects for weighting.
In addition to sampling error, question wording and practical difficulties in conducting surveys can introduce error or bias into the findings of public opinion polls.
For more details on Gallup’s polling methodology, visit www.gallup.com.